SES Principal Investigator Prof. Ailsa Henderson examines where the unpredictability is coming from at this election as voters struggle to make their minds up amid an uncertain polling picture.
The 2026 election has been an under-polled election, with roughly half the number of normal opinion polls compared to 2021. There can be methodological reasons why opinion polls conducted in the last week differ from eventual results but there are also five sources of electoral volatility worth keeping in mind as we await the results. Some of which are perennial disruptors, others are specific to the 2026 contest.
First, we know from previous elections that one third of Scottish voters are late deciders, making up their minds about how to vote either in the last few days of the campaign or at the polling station itself. In both 2021 and 2024, eleven percent decided at the polling station how they’d cast their ballot. In 2021 one fifth decided in the last few days while that rose to one quarter in 2024. Obviously having one third of the electorate still undecided as the last week of the campaign begins is a source of volatility and can explain why polls ahead of time differ from eventual results.
Second, this looks like it might well be a low turnout election. Turnout in devolved elections varies considerably, from lows around 50% in 2003 and 2011 to the a high of 63.5% in 2021. When we want to estimate likely turnout we use a 0 to 10 unlikely to likely to vote scale.
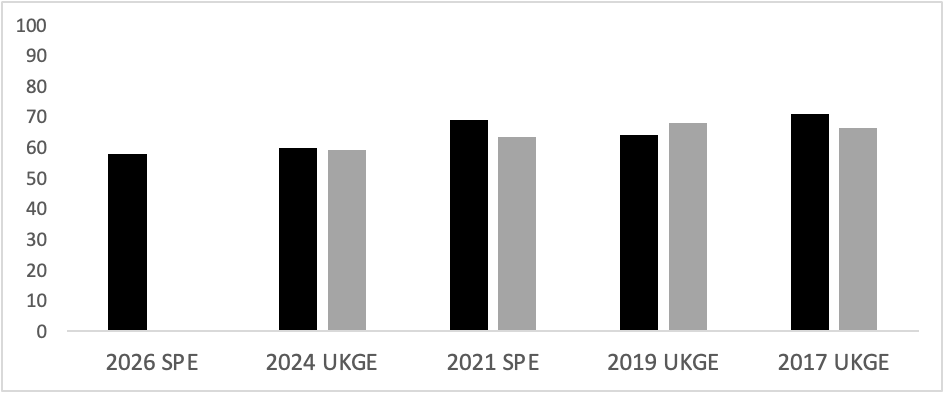
Our February 2026 Scoop poll (a sample of 1,517 voting-age adults resident in Scotland) had 58 percent indicate that they were 10/10 likely to vote. This is at the low end of likelihood to vote in light of recent UK or devolved elections, as Figure 1 shows. This figure compares our poll with equivalent polls by YouGov the same distance out from each election so that we can strip out issues of timing or polling house effects (all linked below this article). In 2021, the March YouGov poll had 69% saying they were 10/10 likely to vote so the 2026 proportion is down ten points. Equivalent polling for Ipsos shows a five point drop from 2021.
But we also now that the eventual turnout figure in 2021 was lower than the percent saying the were 10/10 likely to vote. Across the range of recent elections, eventual turnout has been lower than the stated 10/10 likely to vote figure in three of four elections. If the trend from 2021 occurs again, we would be looking at turnout of 52.5% in this election. That might sound like a significant drop but it’s worth remembering that 2021 was the unusual election and turnout in the low to mid 50s would be more normal for devolved elections.
Partly this is relevant because we know from the academic literature that certain demographic groups are more likely to vote, and if those groups are more likely to support particular parties low turnout can have an uneven effect on the electoral fortunes of parties. If older voters are more likely to support the Conservatives, then low turnout elections can help that party more than others. Low turnout among SNP supporter in the 2017 Westminster election is also credited with a dip in electoral success for the SNP (from an admittedly high bar). If we look at stated intention to vote, figures are highest for Conservative supporters (78%) and SNP supporters (75%), but lower for Labour and Liberal Democrat supporters (63%). Perhaps not surprisingly, those who don’t yet know how they’re going to cast a ballot are least likely to indicate that they are 10/10 to vote.
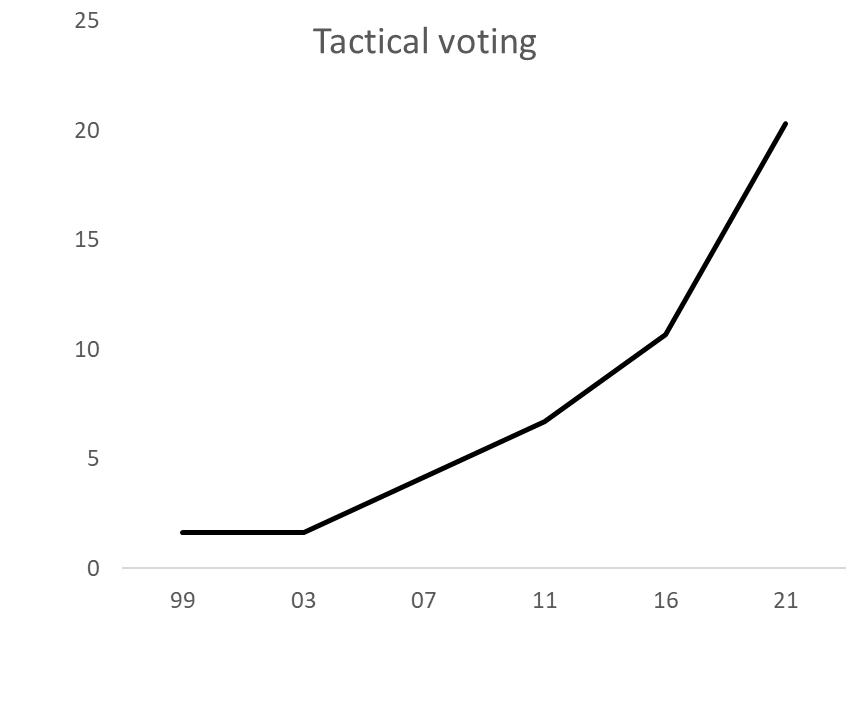
A third source of volatility is the scale of tactical voting. The rates of tactical voting have increased over time according to SES data, as Figure 2 shows. By 2021 we reached the point where one in five votes on the constituency ballot were cast tactically. In our February SCOOP, 15% of respondents told us that they were planning to cast a tactical ballot.
Histories of Scottish voting behaviour highlight the Scottish electorate’s negative partisanship towards the Conservative Party. Party support was defined as much by which party people disliked as those they liked. This is not what we’ve seen of late. For the last two elections in Scotland, almost all tactical voting was anti-SNP tactical voting, reaching 83% of all tactical votes cast in 2021. For the current election, more than half of those telling us they intend to cast a tactical vote indicate that they will vote to stop the SNP from winning. This proportion has dropped in part because there is now a sizeable portion of voters planning to cast an anti-Reform tactical vote.
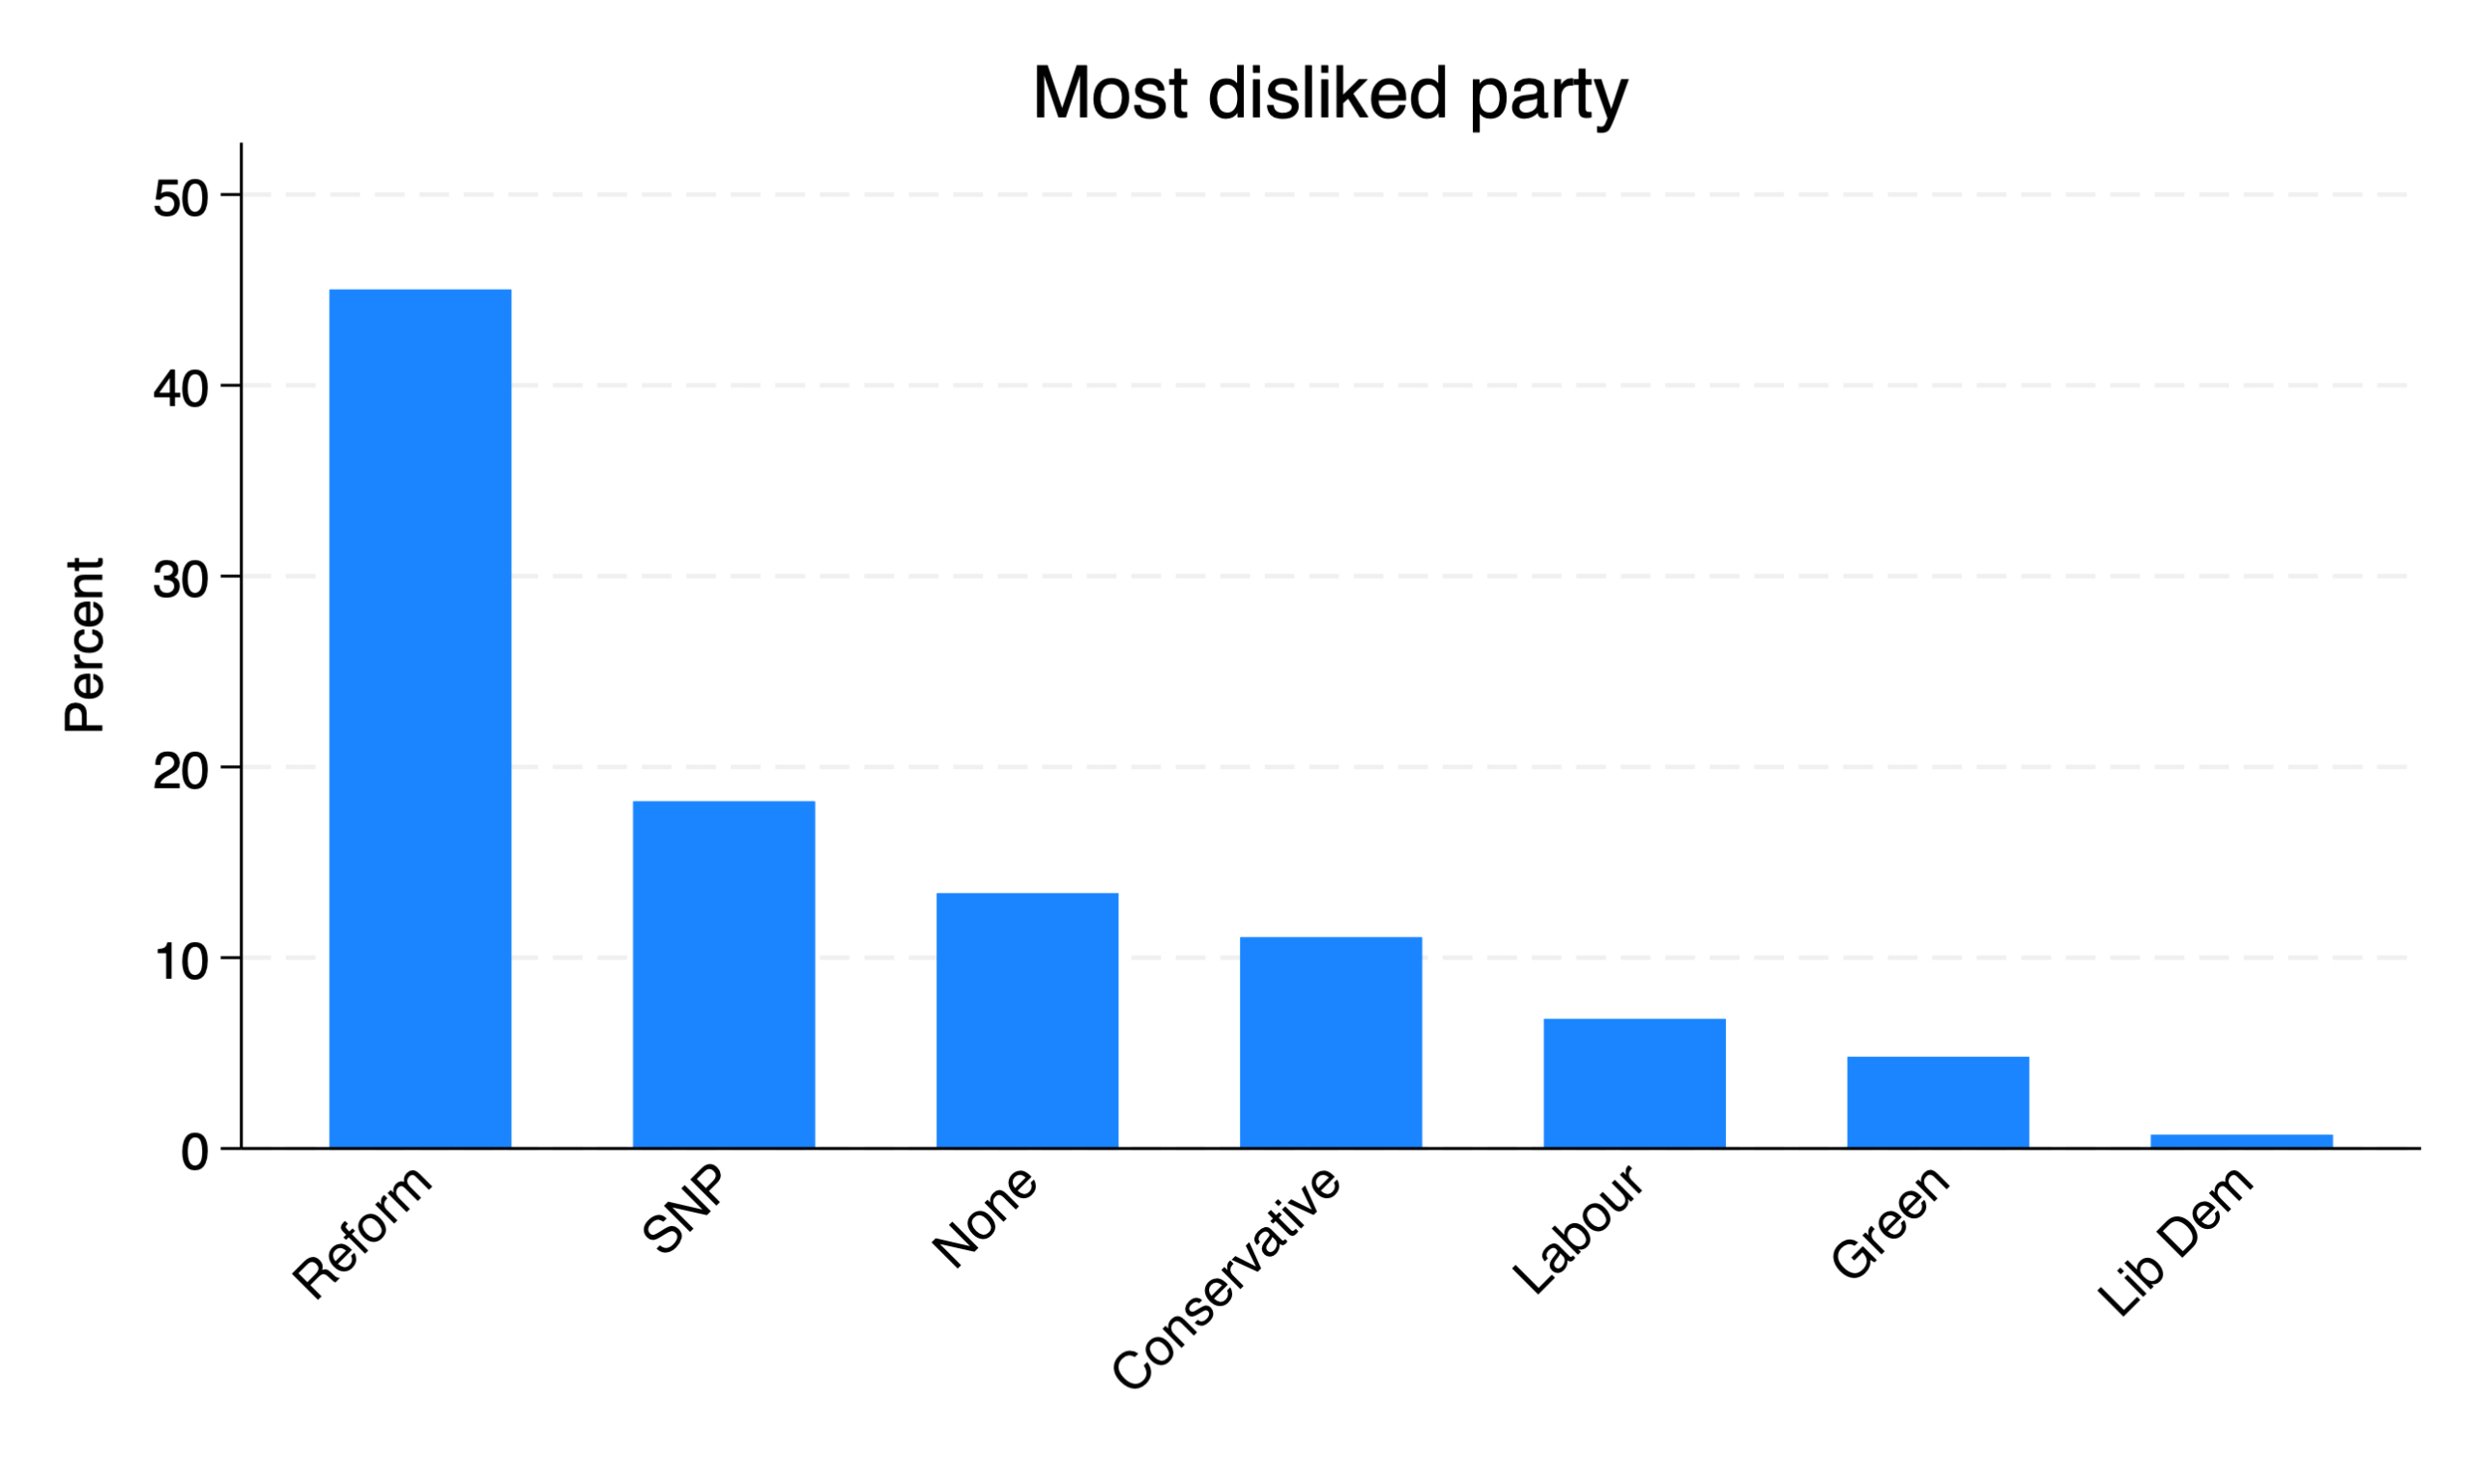
To understand tactical voting we asked voters which party they liked best and those they disliked the most. This was part of a wider battery of questions to understand tolerance to parties and other social groups. Our findings clearly show that Reform is the most likely to be labelled as the least liked party, a finding consistent with what we also know from the propensity to vote (PTV) questions, which ask how likely one is to vote for a range of political parties on a 0 (very unlikely) to 10 (very likely) scale.
Taken together, these figures suggest that the tactical voting we have captured in the dataset capture the pre-existing anti-SNP vote, but might not yet be a full expression of the anti-Reform tactical vote. Partly this stems from two other sources of volatility in the election: a new party, and new constituency boundaries.
When voters reach decisions about how to vote tactically they are using past information as a guide. This includes past election results in their constituency, as well as recent opinion polls. The arrival of Reform in 2024 and their performance in polls since then means that old election results are less useful to understand how parties are faring in local contests.
The new constituency boundaries will also weaken the information role of past election results. Boundaries Scotland reviews electoral boundaries every 8 to 12 years to ensure that the value of one vote is roughly the same across the country. As a result of its 2025 review roughly two thirds of constituencies have new boundaries, especially in the central belt where population movement has been considerable. The arrival of new neighbourhoods into constituencies can decrease the certainty voters have about ‘politics as usual’ and can disrupt tactical calculations.
Of course, each of these sources of volatility interact. Are late deciders different in their preferences? Yes. In 2021, late deciders were far more likely to back Labour and Liberal Democrat candidates than those who decided in the year before the election how they’d vote. But it is also the case that those deciding late were more likely to cast a tactical vote, something which compounds the unpredictability of the election.
2024 poll: (Scottish sample n=1,043 26-29 April) https://ygo-assets-websites-editorial-emea.yougov.net/documents/Internal_AdhocIVScotland_240429_W.pdf
2021 poll: (Scottish sample n =1,100 4-8 March) https://docs.cdn.yougov.com/5jtqxj3u8b/TimesResults_Scotland_210308_W1.pdf
2019 poll: (Scottish sample n= 1,059 30 Aug- 3 September) https://d25d2506sfb94s.cloudfront.net/cumulus_uploads/document/o91qppx58r/TheTimes_190903_ScotlandVI_Trackers_ww.pdf
2017 poll: Scottish sample n=1,017, 24-27 April https://d25d2506sfb94s.cloudfront.net/cumulus_uploads/document/2sjw512ap2/TimesResults_170427_Scotland_WestminsterVI_R1_W.pdf