
SES Co-Investigator Professor Christopher Carman (christopher.carman@glasgow.ac.uk) dives into Scottish Election Study data to explore whether Scottish voters are learning to game their own electoral system — and what that might mean for the elections on 7 May.
Every five years, voters across Scotland collect two ballot papers on their way into the polling booth. One is blue. One is peach. For many voters, the instinct is to mark an X for the same party on both. But a growing number of Scots are working out that both papers deserve strategic thought — and that the strategic calculation is different on each.
There are, in fact, two distinct forms of tactical voting in Scottish elections. On the constituency ballot, voters may choose to ‘lend’ their vote to whichever candidate is best placed to defeat the party they most want to stop, setting aside their sincere first preference. On the regional list ballot, a different logic applies: voters may give their list vote to a smaller allied party rather than their first choice, because the way regional seats are allocated means their favoured party’s list votes may return very few additional seats. Understanding why requires a look at how the system actually works.
How Scotland’s Additional Member System works
Scotland uses the Additional Member System (AMS), a hybrid design that combines two very different methods of electing MSPs. Think of it as two elections happening simultaneously.
The constituency ballot (blue paper) elects 73 MSPs, one per constituency, using simple First Past the Post: whoever gets the most votes in that constituency wins the seat. Simple, familiar, and quite brutal to smaller parties.
The regional list ballot (peach paper) works completely differently. Scotland is divided into eight electoral regions, each electing seven additional MSPs from party lists, using a formula called the D’Hondt method. These 56 regional seats are explicitly designed to act as a proportional corrective — topping up parties who were under-represented by the constituency results.
The interesting part is in how the D’Hondt formula allocates those regional seats — because it is where the second form of tactical voting becomes both possible and, for some voters, very attractive.
The D’Hondt formula: how regional seats are allocated
Regional list seats are awarded in seven rounds per region. In each round, every party’s total regional vote is divided by the number of seats they have already won — constituency seats plus any list seats already awarded in earlier rounds — plus one. The party with the highest resulting quotient wins the next seat, their divisor increases by one, and the process repeats.
The crucial consequence is this: every constituency seat a party wins increases the divisor applied to its regional list votes. Win nine constituencies in a region and your list votes are divided by ten before competing for the seven regional seats. For a party that sweeps the constituencies, this makes their list votes very hard to convert into additional seats. The table below illustrates how the divisor grows:
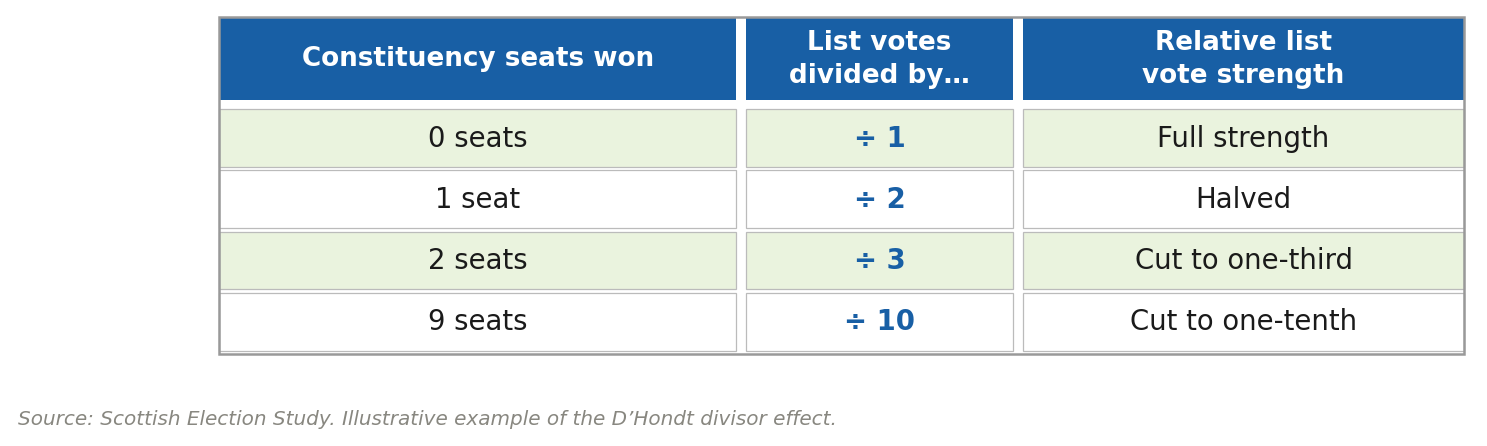
This is sometimes called the D’Hondt ‘penalty’ — though that framing is misleading, because it is not designed to punish anyone. It is designed to prevent a ‘false majority’: a party sweeping 100% of the seats on, say, 40% of the vote. Think of the formula as a proportionality engine. But it does create a clear strategic incentive for list-vote splitting.
Do Scottish voters understand the system?
What does the Scottish Election Study data tell us about how well the public actually grasps all of this? The picture is mixed — and meaningfully so.
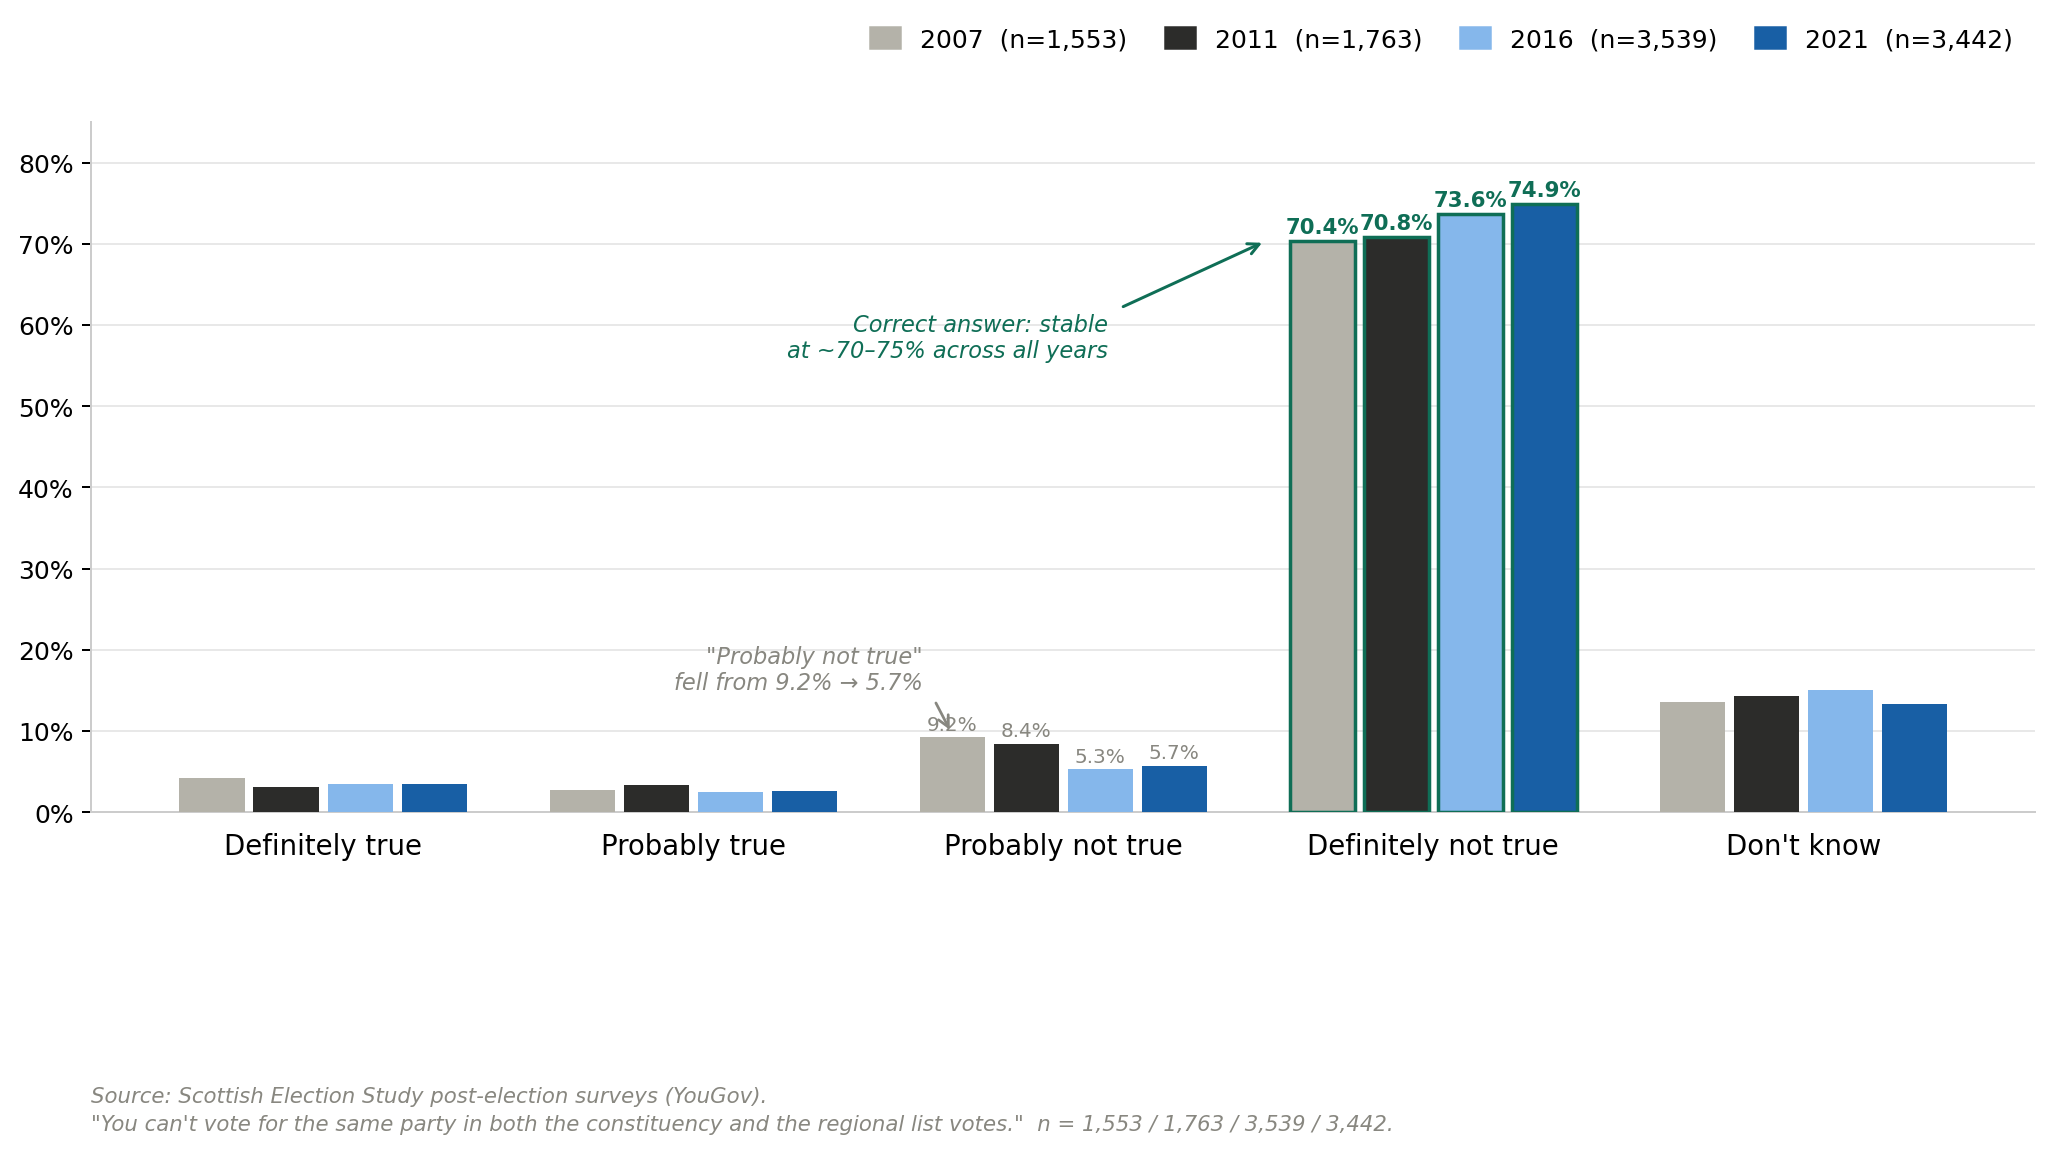
On the most basic question, Scots score well. Our surveys ask whether it is true that ‘you can’t vote for the same party in both the constituency and the regional list votes.’ Across all four election studies from 2007 to 2021, roughly 74–75% of our respondents correctly identified this as ‘definitely not true’ — and the proportion saying ‘don’t know’ has remained stable at around 13–15%. The baseline grasp of the system’s two-ballot structure is solid.
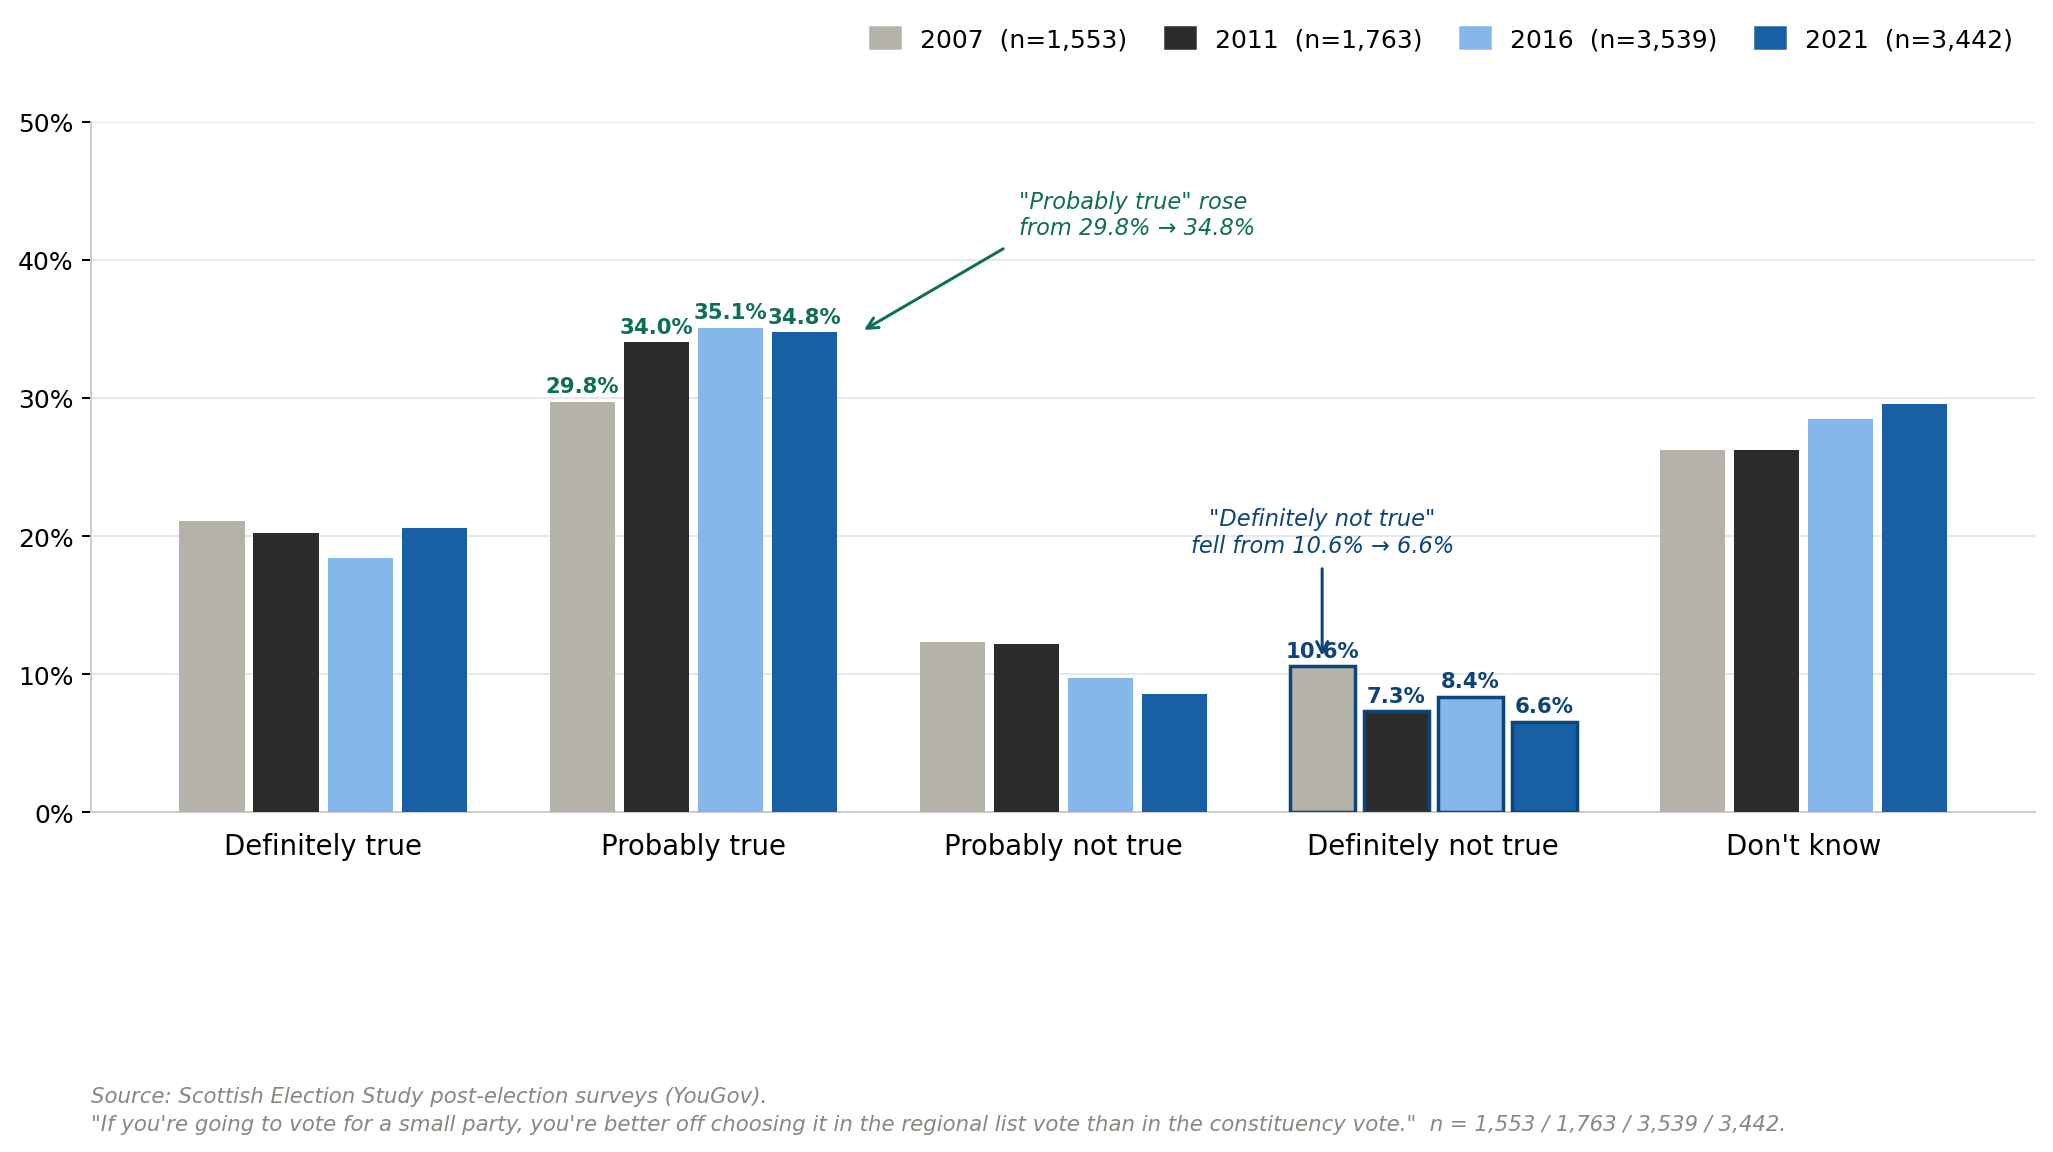
The question about small-party advantage is more revealing. We ask whether it is true that ‘if you’re going to vote for a small party, you’re better off choosing it in the regional list vote.’ A consistent majority agrees — roughly 50–55% across all four surveys say ‘definitely’ or ‘probably’ true. But around 28–30% say ‘don’t know’ across every wave — a persistently large pool of uncertainty. Even after the 14 years of voting under the AMS system we tracked in the SES, just shy of one third of the electorate was uncertain about the regional list.
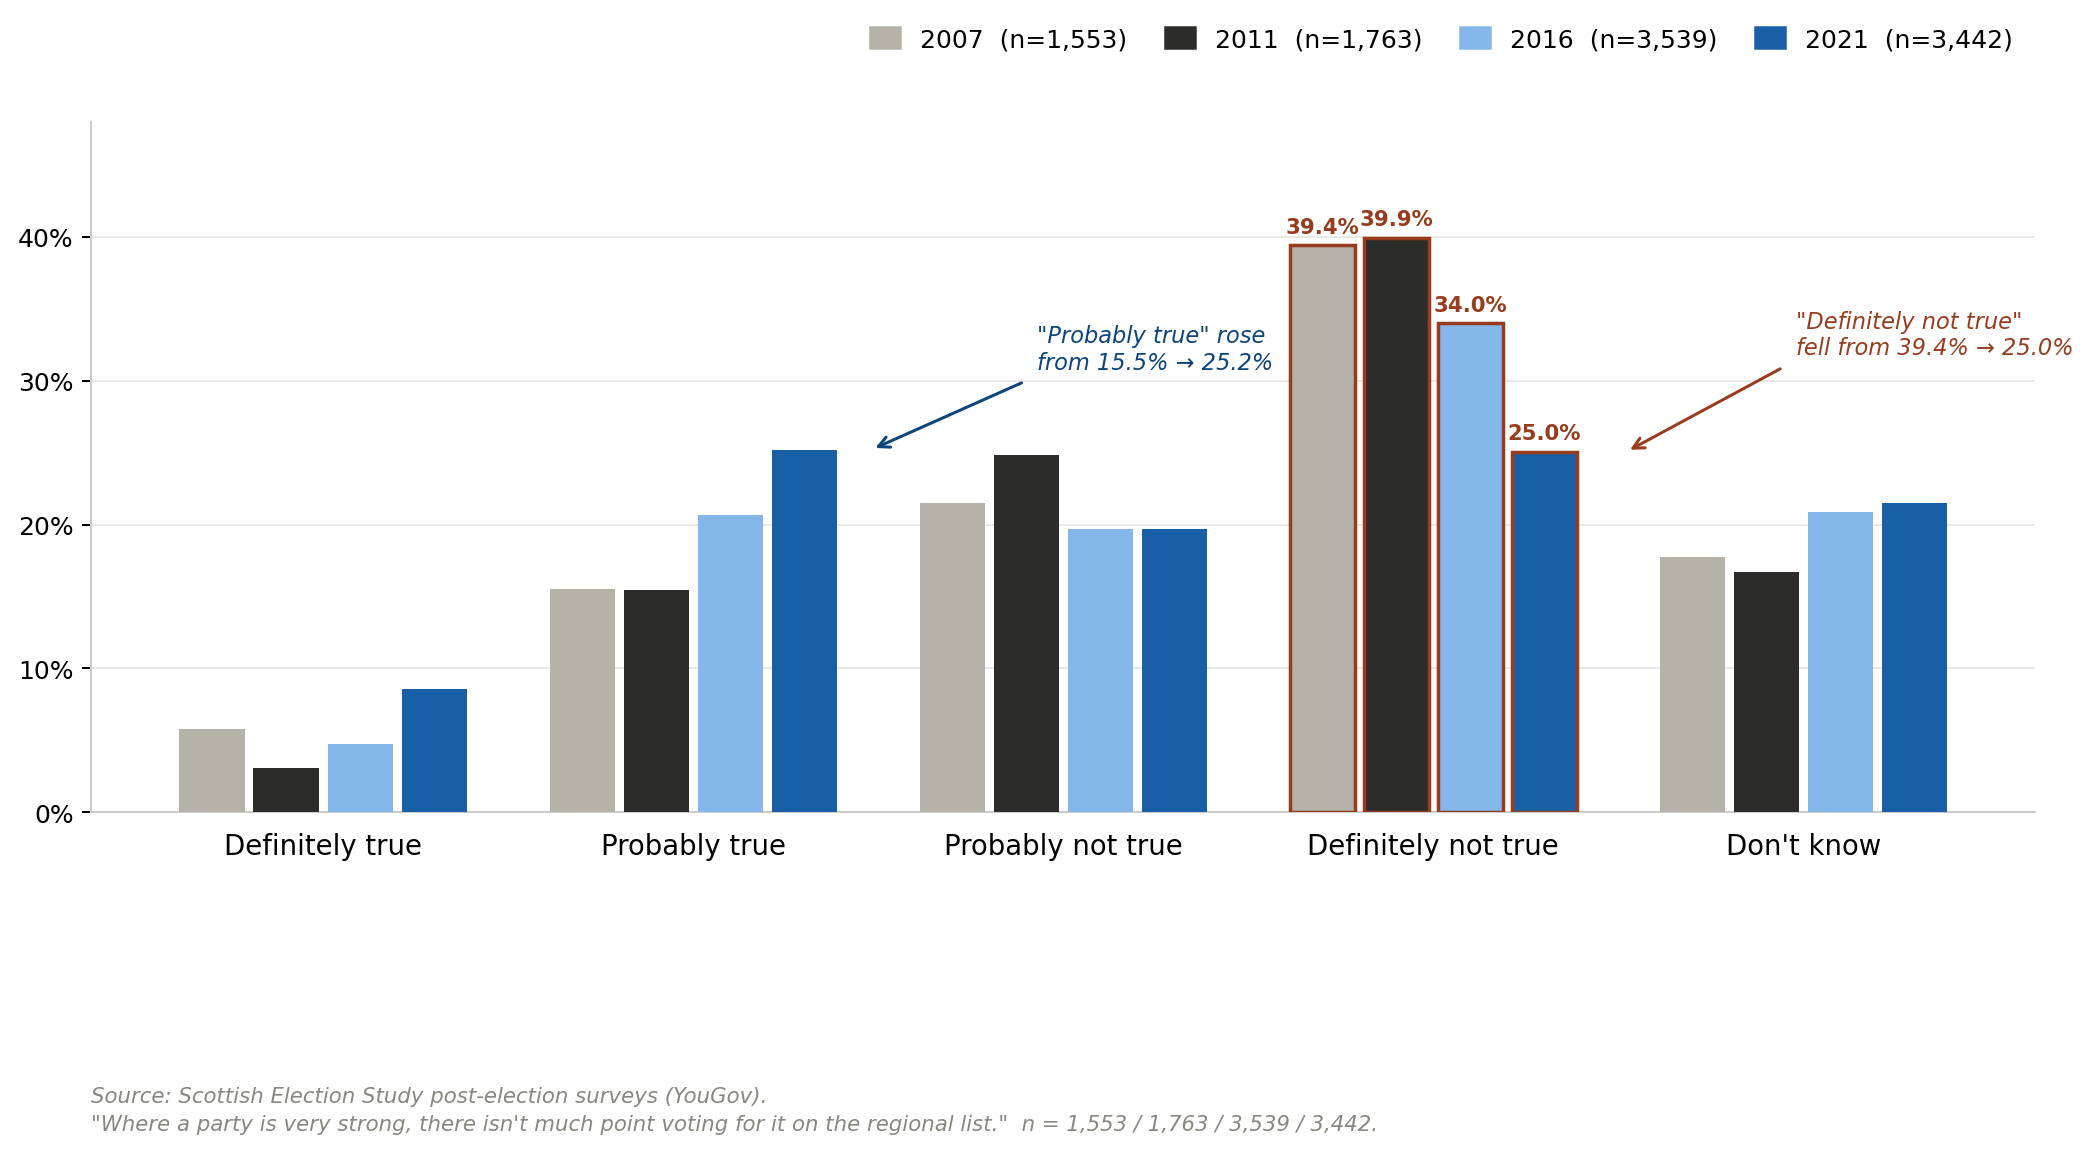
The sharpest trend, however, is on the question of whether ‘where a party is very strong, there isn’t much point voting for it on the regional list.’ This is the most sophisticated of our three knowledge questions — it captures the specific D’Hondt logic that underpins strategic list-vote splitting. And here, something striking has happened.
In 2007 and 2011, only around 21% of respondents said this was ‘definitely’ or ‘probably’ true. By 2021, that had risen to 33.7%. Simultaneously, the proportion saying ‘definitely not true’ fell from around 39–40% in 2007–2011 to just 25% in 2021. Scottish voters are, slowly but measurably, developing a more sophisticated understanding of how the regional list ballot actually works.
A persistent information gap remains. Across all four waves, between 15% and 30% of respondents are either incorrect or unsure about the basic mechanics of how votes translate into seats.
The tactical turn: what voters actually did
The most direct measure of tactical voting in the SES is simple: after the election, we ask voters what their main reason was for voting as they did. One option is ‘it was a tactical vote — I voted to stop another party from winning in my constituency.’
The trend across three elections is striking.
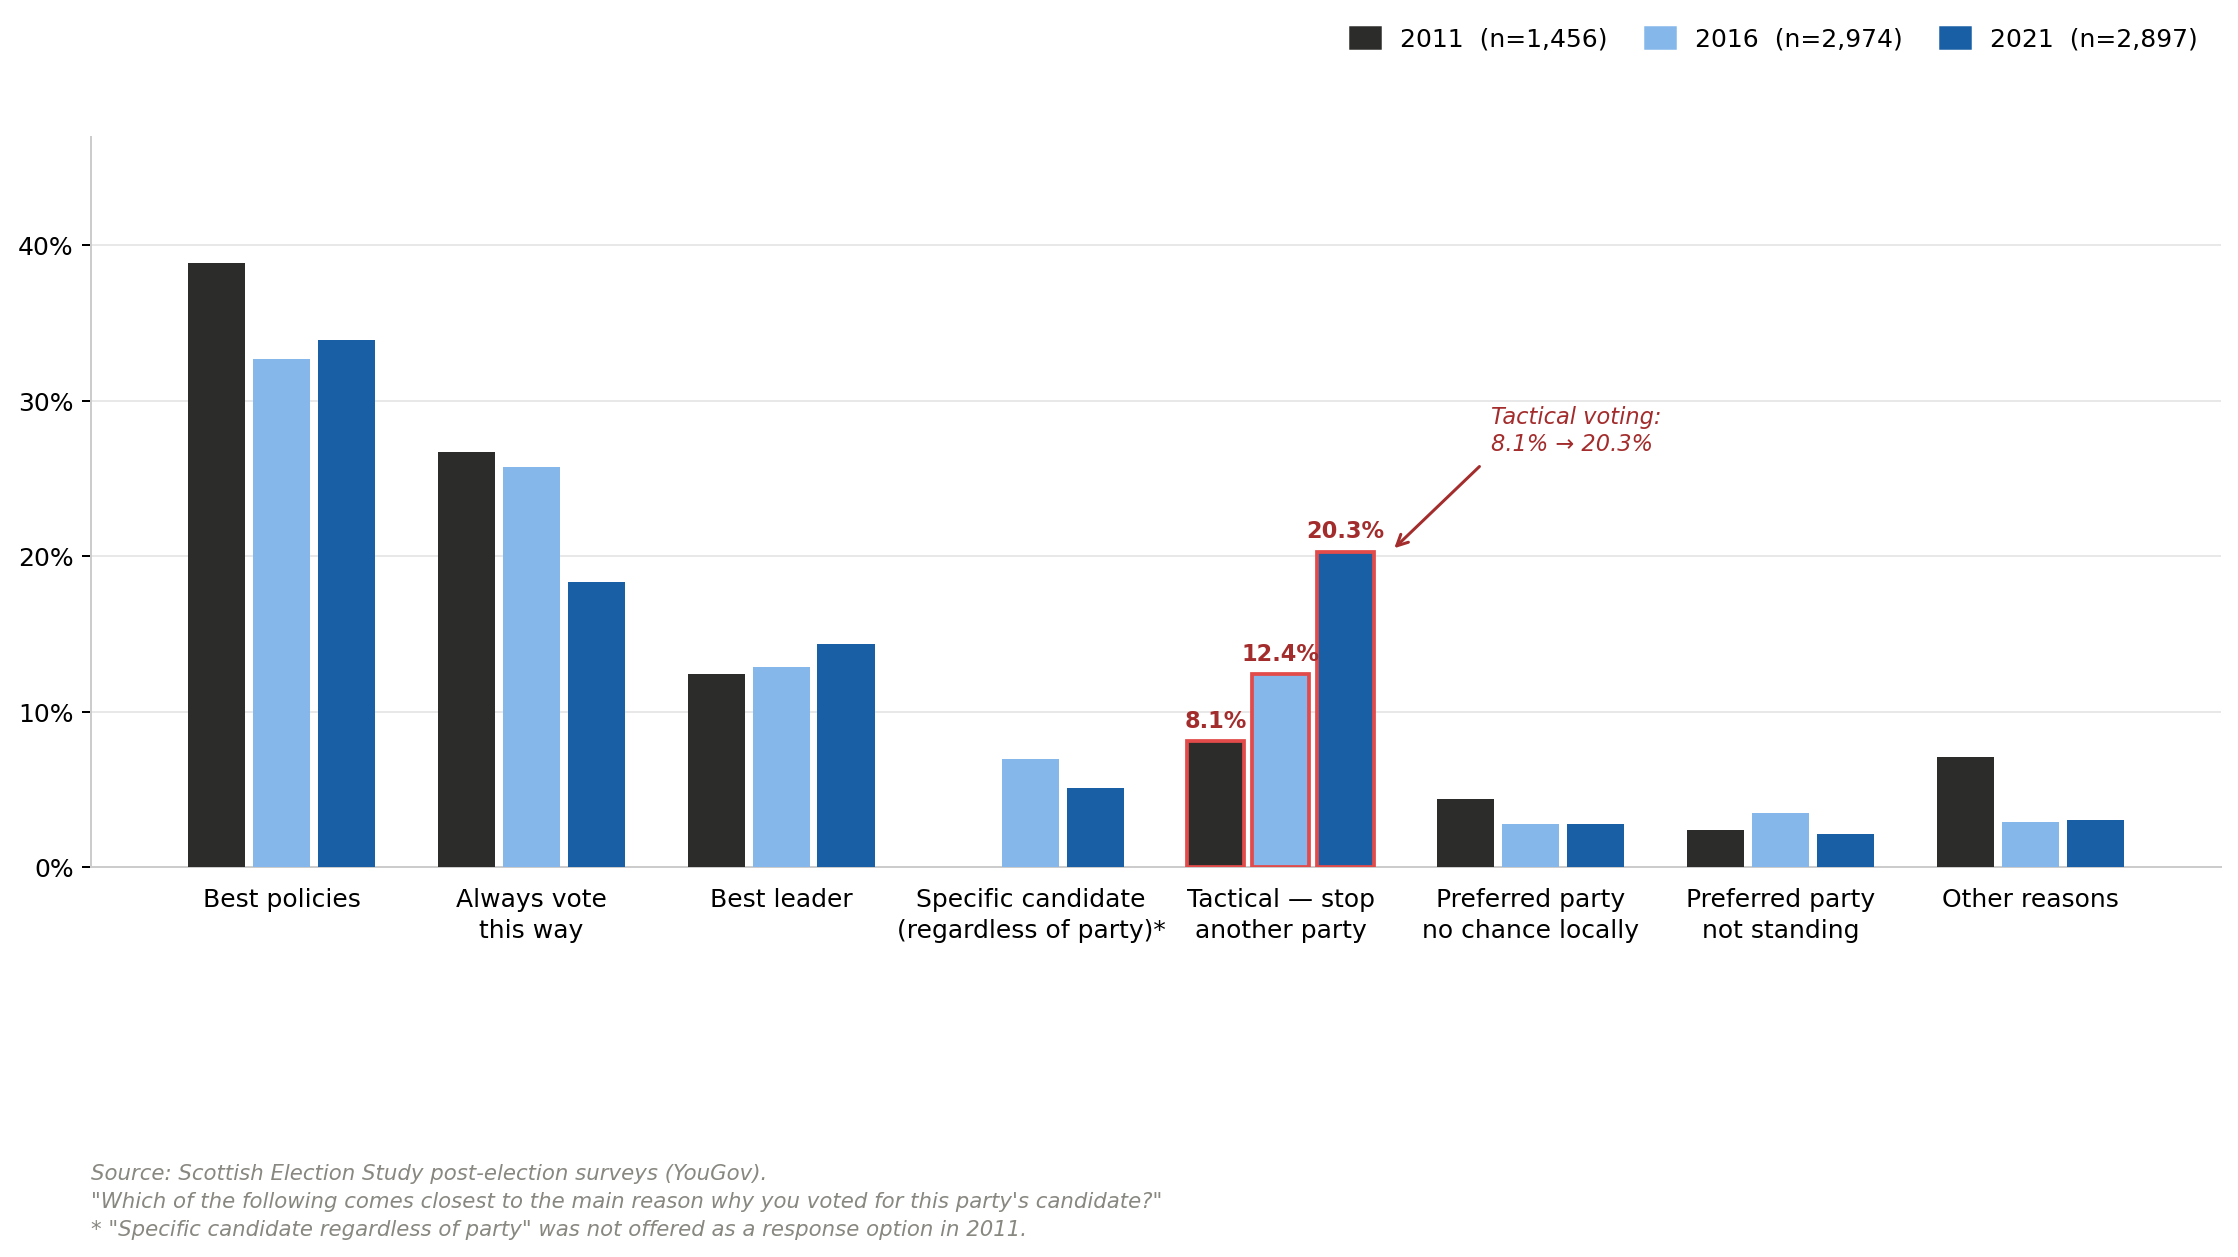
Two things jump out. First, the rise of tactical voting: from 8.1% in 2011 to 12.4% in 2016 to 20.3% in 2021 on the constituency vote — a near-tripling over a decade. (On the regional list, the figure in 2021 was 18.6%, nearly as high.) Second, look at what happened to ‘I always vote this way’: it fell from 26.7% in 2011 to just 18.3% in 2021. Habitual voting is declining; strategic calculation is rising to the point that in 2021, tactical voting was the second most selected vote justification, coming in behind “the party has the best policies”.
The 2021 data on split-ticket voters are particularly illuminating. Among respondents who voted for different parties on the two ballots, we asked a further question: why did you split your ticket? The single most common answer, given by 33% of split-ticket voters, was: ‘I was voting tactically so backed a different party in the constituency.’ The next most common responses were ‘I wanted to make sure there was a wide variety of voices in Holyrood’ (16.6%) and ‘my preferred party was going to do so well on the constituencies that there was no point voting for it on the regional list’ (16.3%) — both of which reflect some awareness of the D’Hondt logic.
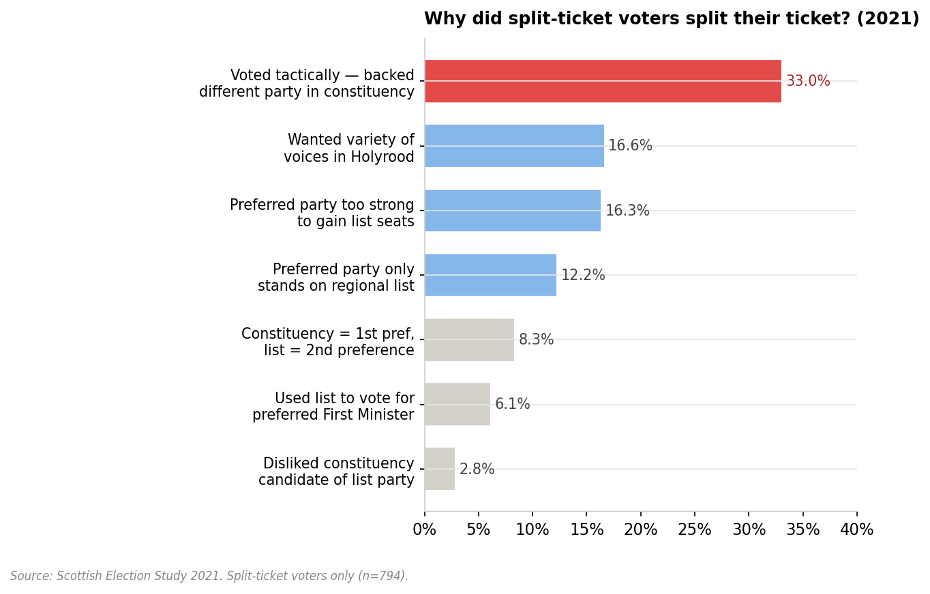
Among the growing group of voters who are actively splitting their ticket, the dominant motivation is explicitly tactical.
What tactical voting looked like on the ground in 2021
The clearest expression of constituency tactical voting in 2021 was the ‘Unionist squeeze’ in a set of key marginals. In seats where the SNP was the main challenger to a unionist incumbent, voters from other unionist parties seemed to ‘lend’ their constituency vote to whichever anti-SNP candidate was best placed to win.
These were not accidents. Campaign groups including Scotland in Union and ThinkScotland ran explicit vote-lending campaigns with online tactical voting calculators. On the pro-independence side, the ‘list vote Green’ campaign urged SNP voters to give their regional ballot to the Scottish Greens — exploiting the D’Hondt logic in regions where the SNP had swept the constituencies. SES analysis confirms that the SNP was the primary target of tactical voting by both pro-unionist and pro-independence voters in 2021.
2026: more parties, more angles
We should be appropriately cautious about extrapolating too confidently to 7 May — the votes have not yet been cast. But the structural conditions for tactical voting in 2026 look, if anything, even more complex than in 2021.
Our February 2026 SCOOP survey found that 15% of respondents already anticipated casting a tactical ballot. Recent MRP polling by Electoral Calculus and YouGov projects a dramatically different parliament from 2021: the SNP on roughly 61–67 seats, Reform UK emerging with 19–23, Labour declining sharply to 13–18, the Greens potentially doubling to 11–14, and the Conservatives falling to single figures.
This creates a more complex tactical map than before. Our data show that anti-SNP tactical voting is still likely to dominate — over half of anticipated tactical votes are in that direction. But around a fifth of tactical voters say they intend to vote against Reform, a dynamic that was not present in 2021 and which cuts across the usual constitutional bloc logic. The arrival of Reform disrupts the clean independence–union framing that has structured tactical calculations since 2007.
On the pro-independence side, the Green party is fielding candidates in only six of the 73 constituencies — meaning the list-vote Green logic is available across almost the entire country. The SNP is running on a ‘both votes SNP’ platform. In Edinburgh Central — a rare Green constituency target — the Greens have pivoted to a ‘both votes Green’ message: an unusual inversion of their usual strategic pitch.
The combination of a more fragmented party system, higher baseline awareness of the D’Hondt logic, active tactical campaigns on multiple fronts, and the new Reform variable suggests tactical voting rates in 2026 may well exceed the record levels we recorded in 2021.
Why this matters beyond who wins
The rise of tactical voting is not just a curiosity for election anoraks. It has implications for how we understand democratic legitimacy and public trust in institutions.
The AMS was designed to produce proportional, representative outcomes. The D’Hondt corrective is the mechanism by which the system self-corrects against FPTP distortions in the constituencies. When voters engage strategically with that mechanism — lending their constituency vote to block a dominant party, or using the list ballot to maximise their bloc’s total seat count — they are not subverting the system. They are, in a real sense, engaging with its internal logic.
What is perhaps more concerning is the persistent minority who are uncertain or mistaken about how the system works — and therefore vulnerable to misleading claims about how to ‘use’ their vote. The rise of online tactical voting guides, AI-generated vote advice, and disinformation means that electoral literacy matters more than ever.
You do not need to be able to work through the D’Hondt calculation yourself. But you should understand enough of the logic to ask the right questions about any tactical voting advice you receive.
Data are from Scottish Election Study post-election surveys conducted by YouGov: 2011 (n=1,763), 2016 (n=3,539) and 2021 (n=3,442). Fieldwork conducted immediately following each election. For access to SES datasets, visit scottishelections.ac.uk .
Tags: AMS, Additional Member System, D’Hondt, electoral system, tactical voting, split-ticket voting, Scottish Parliament, 2026 election