
SES Principal Investigator Prof Ailsa Henderson provides a rapid-response analysis of our most recent data to make sense of the new Prime Minister’s challenges and opportunities north of the border.
With a new Prime Minister getting his feet under the desk, what can Scottish Election Study data tell us about the likely Scottish reaction?
In our recent SCOOP poll we delayed fieldwork so that it would span the recent by-elections, gathering a sample of 1,081 the week before 18 June, and a separately drawn sample of 1,133 immediately after the contests. This allows us to determine whether attitudes to parties changed after [1] Andy Burnham’s win in Makerfield (and then-likely coronation as UK Labour leader and PM) as well as the Conservative win by Douglas Lumsden in Aberdeen South, and SNP retention of Arbroath and Broughty Ferry by Lara Bird.
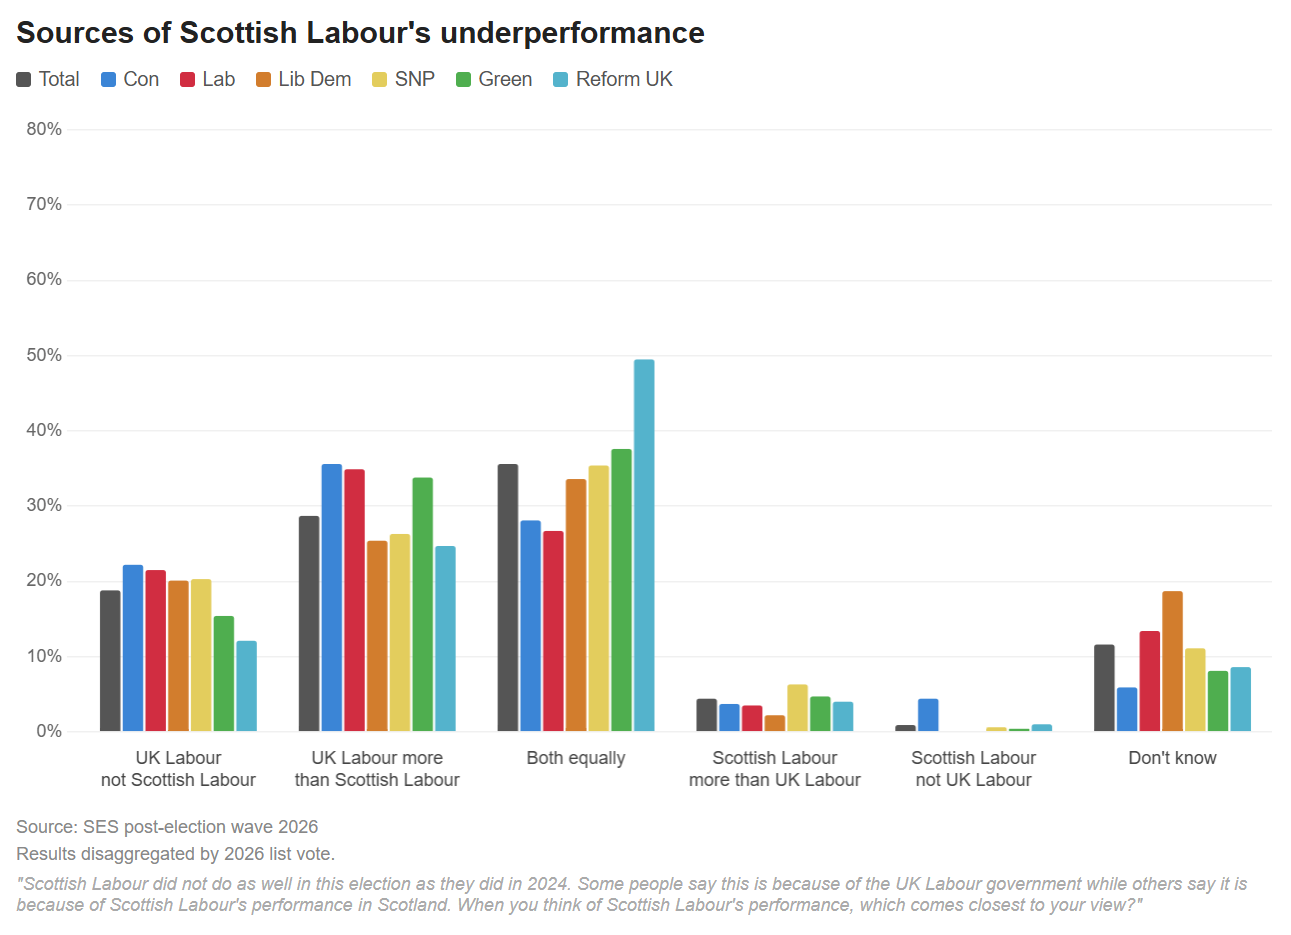
When we asked people in the post-election survey about Labour’s challenges, we offered people the chance to say that current challenges were the fault of Scottish Labour, UK Labour or both to different degrees. The results show that most voters felt both were to blame, but Scottish Labour voters were far more likely to lay the blame at UK Labour.
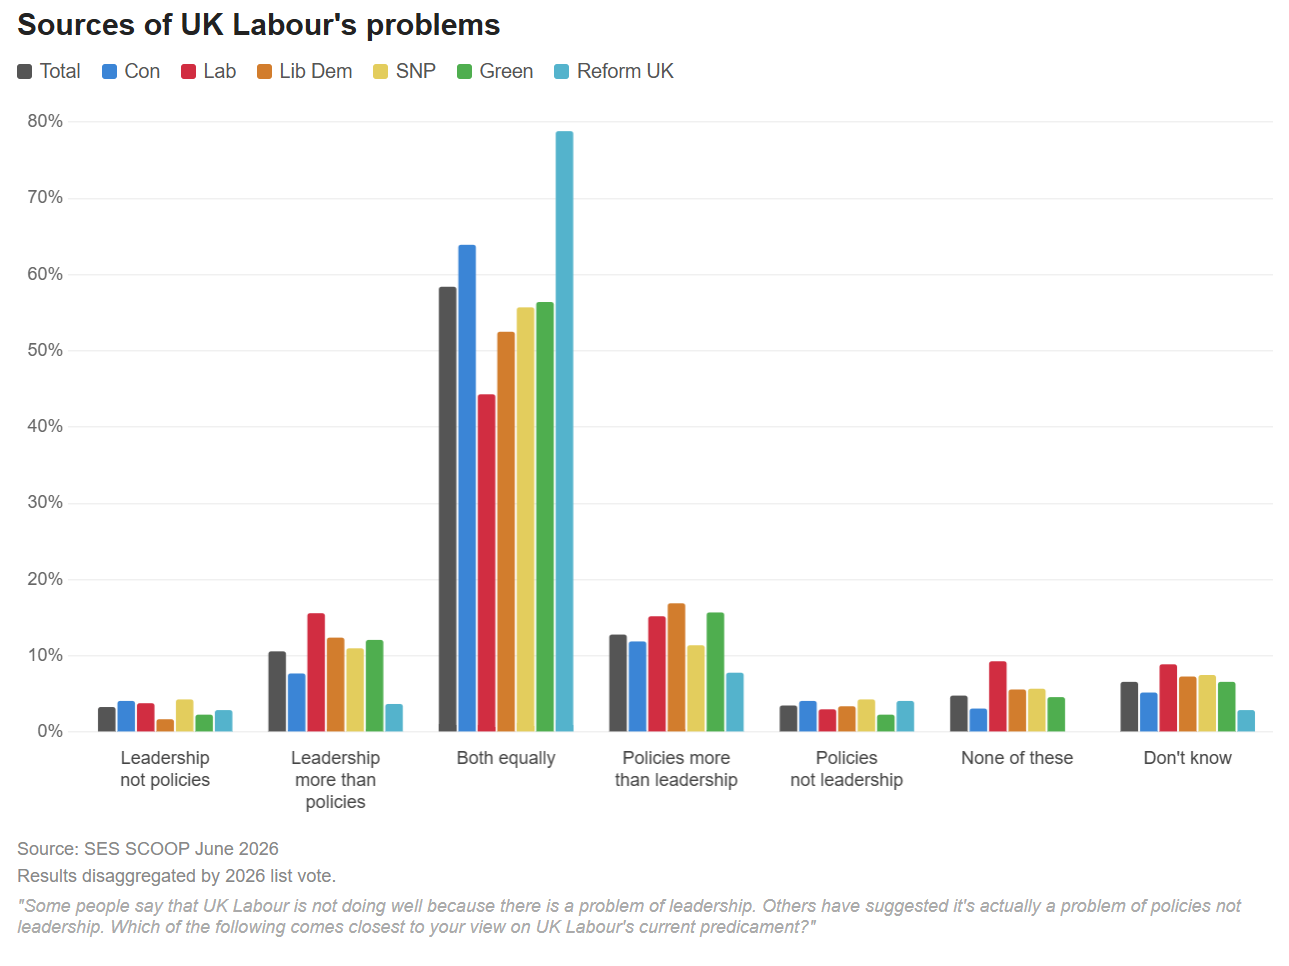
In our June SCOOP we asked a slightly different question about whether the recent challenges were the result of party leadership or party policies. Over half (55%) attributed the current troubles to both.
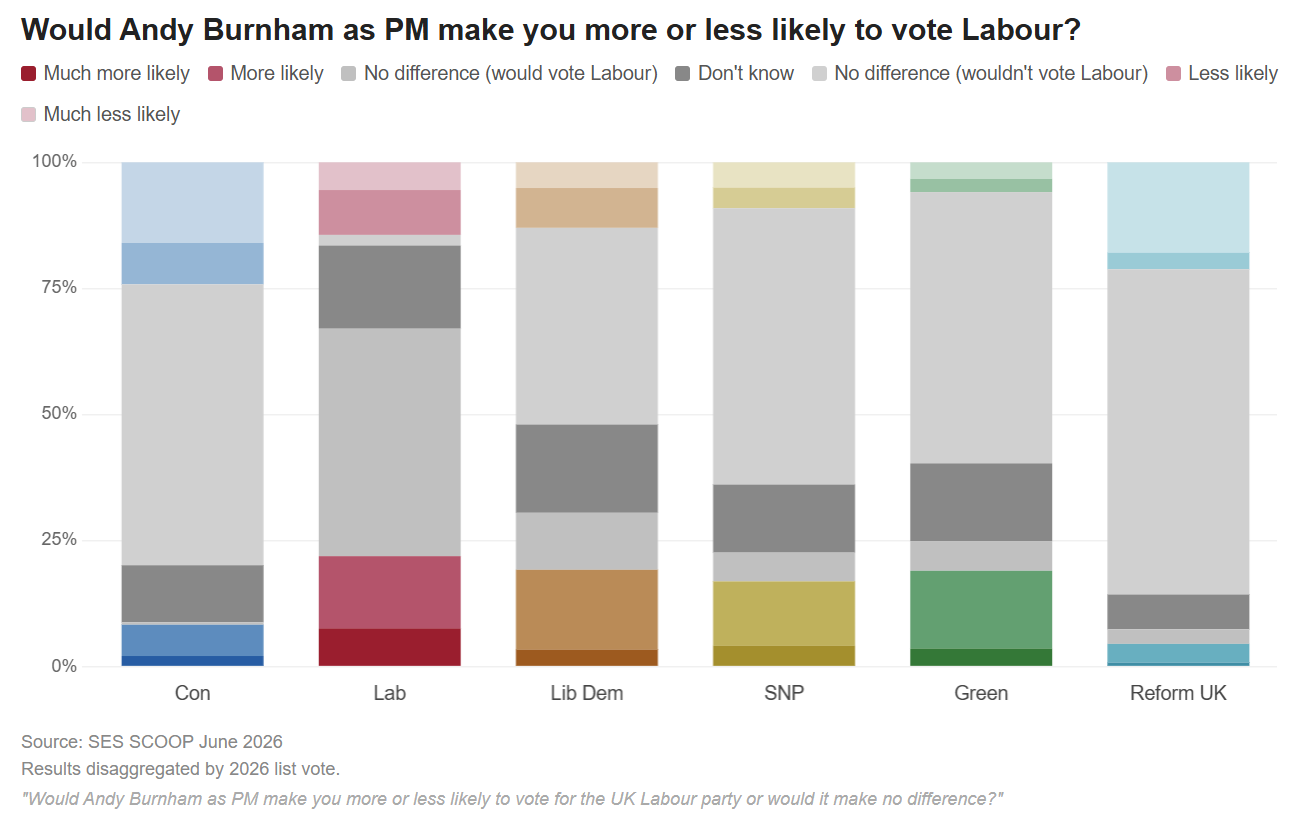
Taken together, these raise questions about the capacity of any new party leader to change the party’s fortunes in Scotland. Perhaps not surprisingly, asked whether Andy Burnham as Labour leader would make someone more or less likely to back Labour, 43% of Scots said it would make no difference, and those most likely to say it would make them more likely to vote Labour where 2026 Labour voters. On this hypothetical question – and we should sound a general note of caution of hypotheticals like these in general – the evidence suggests a modest possible boost.
Another way to test things is to look at responses to questions before and after the by-election and look for greater than margin of error changes in responses. On Holyrood constituency vote intention, we see such modest movement (up 2 points for Labour, up 3 for Conservatives) they suggest no effect at all, and to the extent one is discernible it’s that the Conservatives benefited more from their win in Aberdeen South than Scottish Labour did from the Makerfield by-election result. Shifting to Westminster vote intention, the gain for Labour is larger, about 5 points, so it looks like a change in leadership would make Labour more attractive in a general election in Scotland but these are modest gains.
Less pessimistic and keener to stay in the union?
The more interesting changes are elsewhere. Our question about economic pessimism, ranging from 0 (not at all worried) to 10 (very worried) shows drops of around 5 points for concerns about personal and household finances [2]. It’s too early and too tepid to label this Burnham-led optimism but it is a notable change.
Perhaps most interesting is the shift in attitudes to independence. Respondents in the week following the by-election were more in favour of No, whereas our respondents the week before the by-election tilted Yes. Breaking the analysis to the before and after by-election periods resulted in a 6 point increase in No support and an equivalent drop in Yes support (from 51% to 45% among likely voters). It appeared to have an equivalent impact on identification with being a Yes supporter.
Now, these are not causal changes. They are separated by time in which events happened but we can’t isolate the effect of the Burnham win, or the Lumsden win, or indeed the Bird win, nor can we demonstrate that these democratic events, rather than, say, Scotland’s 14 June win over Haiti in the World Cup, were responsible for the changes.
Electoral ceilings
The new Prime Minister will hope that he improves the electoral fortunes for Labour, and there is certainly grounds for improvement. To assess this potential, we have different ways to evaluate vote intention. One is to ask people which party they will vote for. A second is to ask people to place themselves on a 0 to 10 scale of propensity to vote for a party. In the June SCOOP we devised a third method, asking people whether they could ever see themselves backing a party in the future or not [3].
Here we seek week 1 and 2 effects – with differences before and after the byelections – but these are less interesting than the overall levels for parties in Scotland. We can consider the ‘could see myself’ option to be the total achievable ceiling for a party in Scotland, and the gap between their current vote share and their achievable ceiling the extent to which they are performing at or below their potential vote.
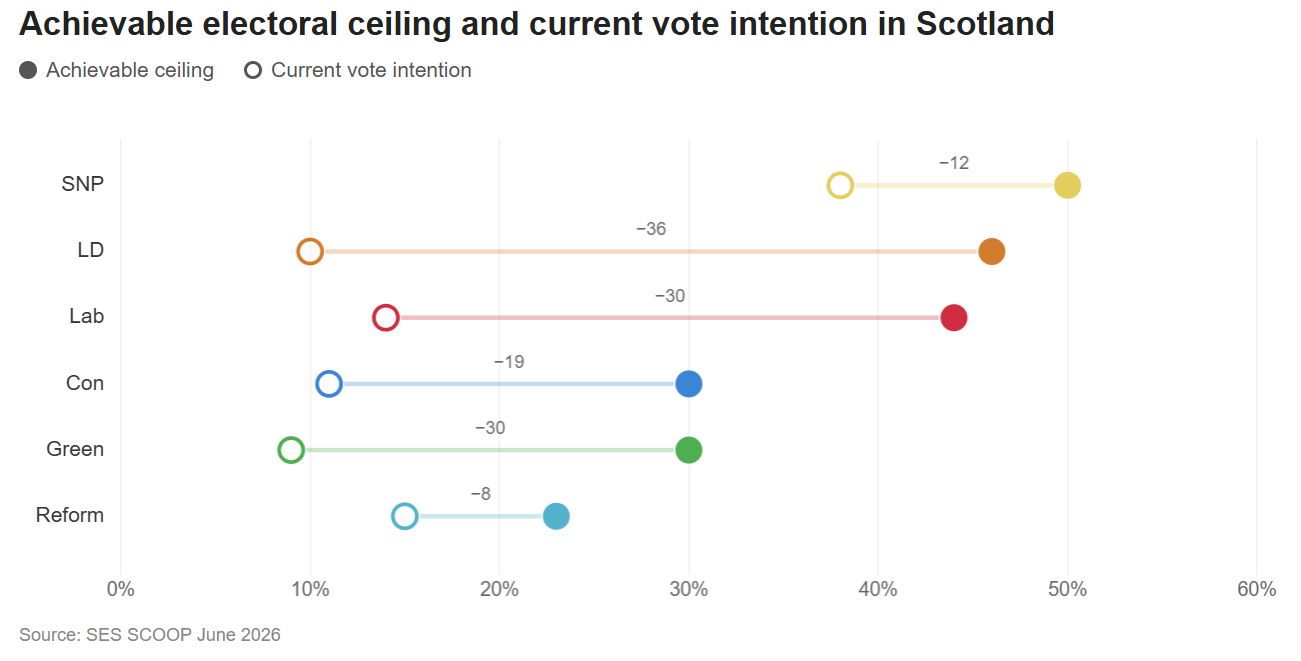
The results show that three parties (Labour, LD, SNP) have healthy ceilings exceeding 40%. Reform has the lowest ceiling. The figures also show that, based on current vote intention, Reform is just about at its achievable ceiling, underperforming by only eight points, compared to the 36 for the Liberal Democrats and 30 for both Greens and Labour. This in itself is interesting, but it’s also the case that the week 2 ceilings, while within the margin of error for many parties, have increased by six points for Labour and by nine points by the Conservatives. It’s not clear whether it’s time or the by-elections, but an increased electoral ceiling for the two UK incumbents recently giving a kicking at the polls must be rare grounds for celebration.
[1] After is not the same as ‘as a result of’
[2] Respondents in categories 9, 10 very worried/10 for ‘your personal economic security’ went from 22% to 16%, and the equivalent change for ‘Your family’s economic security’ changed from 19% to 15%.
[3] Earlier, we asked you how likely you are to vote for various parties. This question is a Yes-or-No version of that one. For each party, please say whether you can see yourself voting for that party at some point, or whether you can’t see yourself ever voting for them. <1> Could see myself voting that way <2> Couldn’t see myself ever voting that way <3> Prefer not to say